
Equity funds suffered a punishing month of outflows in June as the global bear market[1] shook investor sentiment, according to the latest Fund Flow Index from Calastone, the largest global funds network. Investors withdrew a net £1.06bn of their equity-fund holdings during the month, taking 2022’s cumulative net outflow to £1.94bn.
UK-focused funds bore the brunt of selling

UK-focused funds are being hit hardest. UK investors sold down a record £1.14bn of funds focused on their domestic stock market. These funds have now suffered outflows for thirteen consecutive months, the longest stretch on Calastone’s record. Since June 2021, when the selling began, £6.44bn has left the category. Outflows from UK-focused funds have been driven especially by a sharp drop in buying interest – sell orders have only increased slightly.
Many other equity categories had a bad month too. Global, European, emerging markets, technology funds, smaller companies – all these saw outflows too.
Income funds and ESG bucked the trend – enjoying inflows

Income funds continued to shine, however. They enjoyed their third consecutive month of inflows after years of steady selling as investors switched to defensive options more likely to ride out the downturn in the market and the real economy.
Index funds are seeing greater outflows than active ones, even after the success of ESG is accounted for
Cutting across these sectors is the active v passive style of management. Passively managed index-tracking funds have borne the brunt of selling year-to-date, with a similar pattern across most categories of fund. They suffered their second-worst month on record in June (their worst was in March). Since January, outflows have totalled £2.60bn, contrasting with £633m of inflows to active funds. ESG equities (which are mainly actively managed) have driven much of this difference – they have seen inflows of £2.25bn year-to-date and enjoyed another good month in June (+£292m). Even without the help from ESG, active funds have done better year-to-date, however.
Fixed income and mixed assets also saw outflows in June
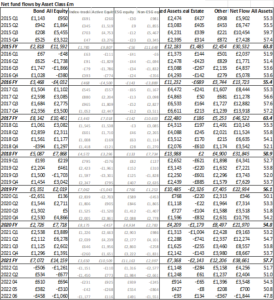
Bond funds fared little better than equities. They suffered outflows of £458m as investors absorbed the falling bond prices that accompany higher market interest rates. Fixed income funds have shed capital in three of the last six months, only the second time that has happened in any six-month period on the Fund Flow Index’s seven and a half year record. Mixed asset funds saw outflows of £93m, only the second month since 2015 that Calastone has seen investors withdraw capital from the sector.
Property saw its first inflows in almost four years as investors perceive its defensive qualities
Property funds were a notable exception to the general air of despondency. After suffering outflows for a record 44 months until May, June saw investors add £134m to the sector, the best month since June 2015. Calastone has been reporting a decline in outflows since early 2022, and first noted a decisive reversal towards inflows in the final week of May.
Across all asset types, net outflows were their second worst on record at £1.84bn. The only time outflows were larger was in March 2020, when fixed income markets stood on the brink of collapse in the face of lockdowns until central banks flooded the system with liquidity and calmed the markets. Calastone has only recorded five months in the last seven and a half years when funds have seen overall outflows.
British investors are not alone. Calastone’s upcoming Global Fund Flow Index shows that European investors are even more negative both on equities and fixed income, while investors all over the world are opting for lower risk categories of fund like equity income.
Edward Glyn, head of global markets at Calastone said: “Signs of optimism are scarce as the bear market shreds investor sentiment. UK stocks are however not in bear territory, yet investors are selling out of UK-focused funds more heavily than any other category. This reflects the home-market bias in UK investor portfolios. A reduction in appetite to hold equities will inevitably hit UK-focused funds harder. There might be some bottom-fishing going on too, with some switching from recently outperforming UK equities to very hard-hit North American ones – we noted North American funds saw buying in June.
The greater outflows from passive funds than active ones, even after ESG is taken into account, are especially stark given that passive funds are a smaller category by assets under management. In falling markets, active funds tend to have more opportunities to outperform and this may be driving behaviour.
There is some switching going on too. Equity income funds are clear beneficiaries. In an inflationary, rising-interest-rate environment, income-generating assets are a lower risk option because more of their value is derived from near-term cash flows rather than distant expectations of future profits.
The reappraisal of property is part of the same trend. Rental income is a bit bond-like because commercial tenants tend to have relatively long leases and will look to cut other costs before facing the upheaval of a move. As an asset-backed income investment it therefore looks relatively attractive in today’s environment. But it is not immune. Capital values are sensitive to rising interest rates and a severe recession would inevitably lead to stress among tenants in more cyclically exposed segments like retail or offices, in contrast to more stable segments like healthcare. Finding funds with the right mix of holdings, particularly those with desirable properties that have pricing power, is therefore an important consideration for investors.”
[1] Defined as 20% peak-to-trough decline
METHODOLOGY
Calastone analysed over a million buy and sell orders every month from January 2015, tracking monies from IFAs, platforms and institutions as they flow into and out of investment funds. Data is collected until the close of business on the last day of each month. A single order is usually the aggregated value of a number of trades from underlying investors passed for example from a platform via Calastone to the fund manager. In reality, therefore, the index is analysing the impact of many millions of investor decisions each month.
More than two thirds of UK fund flows by value pass across the Calastone network each month. All these trades are included in the FFI. To avoid double-counting, however, the team has excluded deals that represent transactions where funds of funds are buying those funds that comprise the portfolio. Totals are scaled up for Calastone’s market share.
A reading of 50 indicates that new money investors put into funds equals the value of redemptions (or sales) from funds. A reading of 100 would mean all activity was buying; a reading of 0 would mean all activity was selling. In other words, £1m of net inflows will score more highly if there is no selling activity, than it would if £1m was merely a small difference between a large amount of buying and a similarly large amount of selling.
Calastone’s main FFI All Assets considers transactions only by UK-based investors, placing orders for funds domiciled in the UK. The majority of this capital is from retail investors. Calastone also measures the flow of funds from UK-based investors to offshore-domiciled funds. Most of these are domiciled in Ireland and Luxembourg. This is overwhelmingly capital from institutions; the larger size of retail transactions in offshore funds suggests the underlying investors are higher net worth individuals.