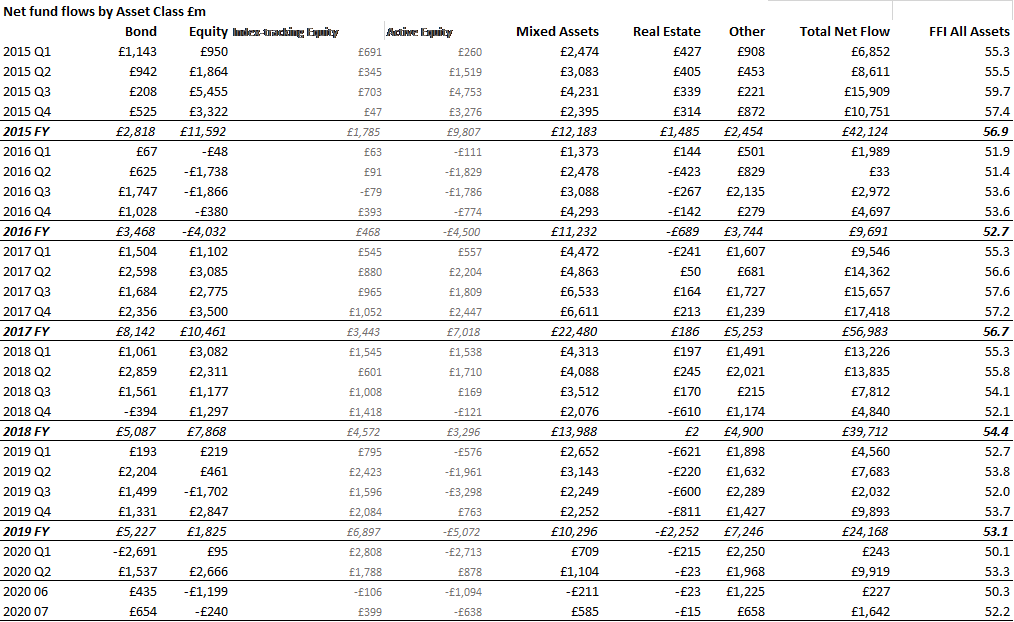
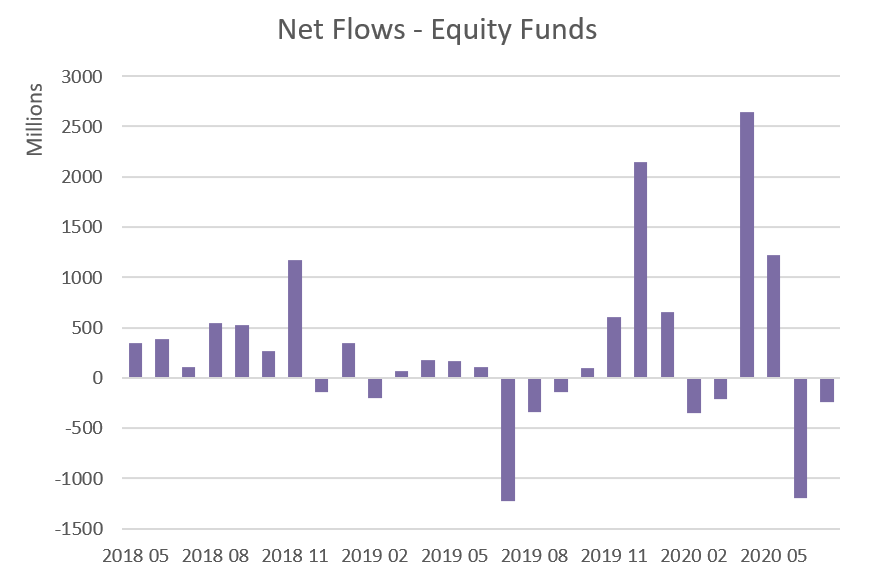
Equity funds suffered a second consecutive month of outflows in July, while fixed income funds enjoyed another month of strong inflows, according to the latest Fund Flow Index from Calastone, the largest global funds network. Overall, equity funds shed £240m in July, but ESG and global funds proved to be successful, not least because most ESG funds are global.
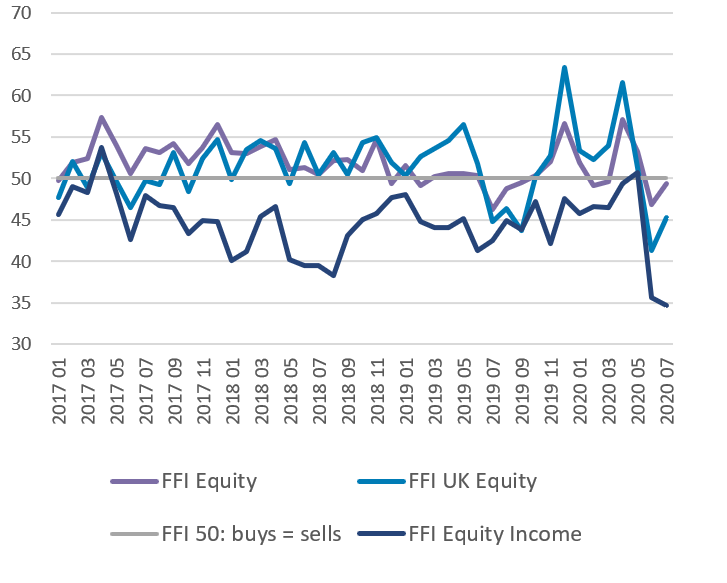
Funds focused on UK equities were hardest hit, seeing outflows of £377m in July, taking the two-month total outflow from UK equities to almost £1.1bn. Outflows from equity income funds accelerated, breaking the record for a second consecutive month as investors redeemed £705m of their holdings. Meanwhile, despite notching up their 26th consecutive month of outflows, European equity funds shed only £62m, their lowest level in almost two years, well below the monthly average outflow of £211m. The reduction in negative sentiment towards European funds reflects a relatively effective response to the pandemic.
 Global equity funds are the most favoured category at present, however. April to July has seen four of the best eight months on record for global fund inflows, with investors committing almost £3.1bn in new capital to the category. £605m of this was in July alone. The skew towards growth stocks partly explains the inflows to global funds (see comment below for explanation).
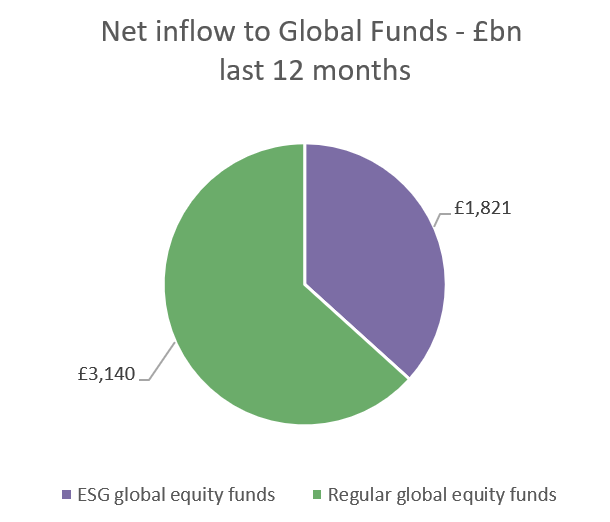
But it is in fact the popularity of ESG funds that gives a real clue as to why global equity funds are getting such a boost. ESG funds are overwhelmingly global in nature(1). Investor preference for ESG has therefore boosted the overall inflows to the global fund category significantly. Over the last year, one third of the money flowing into global funds has been committed to those focused on ESG investing; in June and July, this proportion rose to more than half (July ESG global inflow was £320m v regular global fund inflow of £285m). These figures are all the more noteworthy given the far smaller size of the ESG category in terms of assets under management(2). Calastone’s FFI: Global ESG has averaged an astonishing 78.4 year-to-date, meaning that buying activity has outweighed selling activity more than 3:1. By contrast the overall FFI: Equity has barely stayed in positive territory, averaging 51.0. Moreover, almost all this ESG money is into actively managed funds (99%).
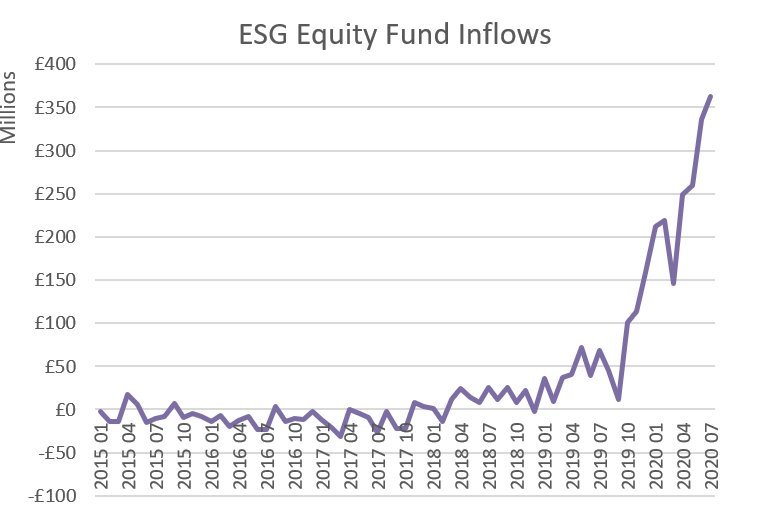
ESG funds are exploding in popularity. Each of the last four months has set a new record for inflows. Moreover, the total £1.2bn that has flowed into ESG funds since April is greater than all the previous five years combined across the entire FFI on record.
Global equity funds are the most favoured category at present, however. April to July has seen four of the best eight months on record for global fund inflows, with investors committing almost £3.1bn in new capital to the category. £605m of this was in July alone. The skew towards growth stocks partly explains the inflows to global funds (see comment below for explanation).
But it is in fact the popularity of ESG funds that gives a real clue as to why global equity funds are getting such a boost. ESG funds are overwhelmingly global in nature(1). Investor preference for ESG has therefore boosted the overall inflows to the global fund category significantly. Over the last year, one third of the money flowing into global funds has been committed to those focused on ESG investing; in June and July, this proportion rose to more than half (July ESG global inflow was £320m v regular global fund inflow of £285m). These figures are all the more noteworthy given the far smaller size of the ESG category in terms of assets under management(2). Calastone’s FFI: Global ESG has averaged an astonishing 78.4 year-to-date, meaning that buying activity has outweighed selling activity more than 3:1. By contrast the overall FFI: Equity has barely stayed in positive territory, averaging 51.0. Moreover, almost all this ESG money is into actively managed funds (99%).
ESG funds are exploding in popularity. Each of the last four months has set a new record for inflows. Moreover, the total £1.2bn that has flowed into ESG funds since April is greater than all the previous five years combined across the entire FFI on record.
 Overall, however, despite the bright spot afforded by active ESG funds, passive funds once again did better than their active counterparts. Active equity funds saw outflows of £638m in July, while passive funds saw inflows of £398m.
Fixed income funds were once again the beneficiary of investor caution. They saw inflows of £653.6m in July. The FFI: Bonds has been in strongly positive territory for 14 of the last 16 months.
Edward Glyn, head of global markets at Calastone said: “Caution on equity markets has prompted outflows from equity funds for two months in a row. Weakness in stock markets in July seems to have justified that scepticism and ensured that June’s outflows from equities continued though at a lower level. But even though capital is leaving equity funds overall, a wide gulf is opening up between those funds in favour and those leaving investors cold. The dichotomy between growth and value helps explains why this is happening.
Record low interest rates are inflating the value of future profits. Growth stocks in particular have more of their value tied up in ‘the future’ so their share prices benefit significantly more when money is cheap. Stocks where more of the income is being delivered today benefit less – their valuation depends more on things going well right now. With so many ‘value stocks’, many of which have cut dividends hard, it’s no wonder the UK stock market has underperformed in the global market rally since March. This explains the outflows from UK-focused funds and helps explain the increased surge in outflows from income funds.
Meanwhile, global funds, where growth stocks make up a larger share of holdings, are benefiting from a flood of inflows. But crucially they are also benefitting from a huge marketing push by the fund management industry in favour of ESG funds, partly in response to very strong investor demand for ESG products and partly because they offer better margins for managers. Indeed because ESG funds tend to be actively managed, they are also the one area of real strength for active equity funds, which are otherwise suffering at the expense of their passive counterparts.”
(1) Global equity ESG funds attracted 80% of all ESG equity inflows in the last twelve months (£1.8bn out of £2.2bn)
(2) At the end of Feb, AUM in ESG funds across all asset classes were £39bn, according to analysis of Lipper data, only a little over 3% of the total in the UK funds market
Overall, however, despite the bright spot afforded by active ESG funds, passive funds once again did better than their active counterparts. Active equity funds saw outflows of £638m in July, while passive funds saw inflows of £398m.
Fixed income funds were once again the beneficiary of investor caution. They saw inflows of £653.6m in July. The FFI: Bonds has been in strongly positive territory for 14 of the last 16 months.
Edward Glyn, head of global markets at Calastone said: “Caution on equity markets has prompted outflows from equity funds for two months in a row. Weakness in stock markets in July seems to have justified that scepticism and ensured that June’s outflows from equities continued though at a lower level. But even though capital is leaving equity funds overall, a wide gulf is opening up between those funds in favour and those leaving investors cold. The dichotomy between growth and value helps explains why this is happening.
Record low interest rates are inflating the value of future profits. Growth stocks in particular have more of their value tied up in ‘the future’ so their share prices benefit significantly more when money is cheap. Stocks where more of the income is being delivered today benefit less – their valuation depends more on things going well right now. With so many ‘value stocks’, many of which have cut dividends hard, it’s no wonder the UK stock market has underperformed in the global market rally since March. This explains the outflows from UK-focused funds and helps explain the increased surge in outflows from income funds.
Meanwhile, global funds, where growth stocks make up a larger share of holdings, are benefiting from a flood of inflows. But crucially they are also benefitting from a huge marketing push by the fund management industry in favour of ESG funds, partly in response to very strong investor demand for ESG products and partly because they offer better margins for managers. Indeed because ESG funds tend to be actively managed, they are also the one area of real strength for active equity funds, which are otherwise suffering at the expense of their passive counterparts.”
(1) Global equity ESG funds attracted 80% of all ESG equity inflows in the last twelve months (£1.8bn out of £2.2bn)
(2) At the end of Feb, AUM in ESG funds across all asset classes were £39bn, according to analysis of Lipper data, only a little over 3% of the total in the UK funds market