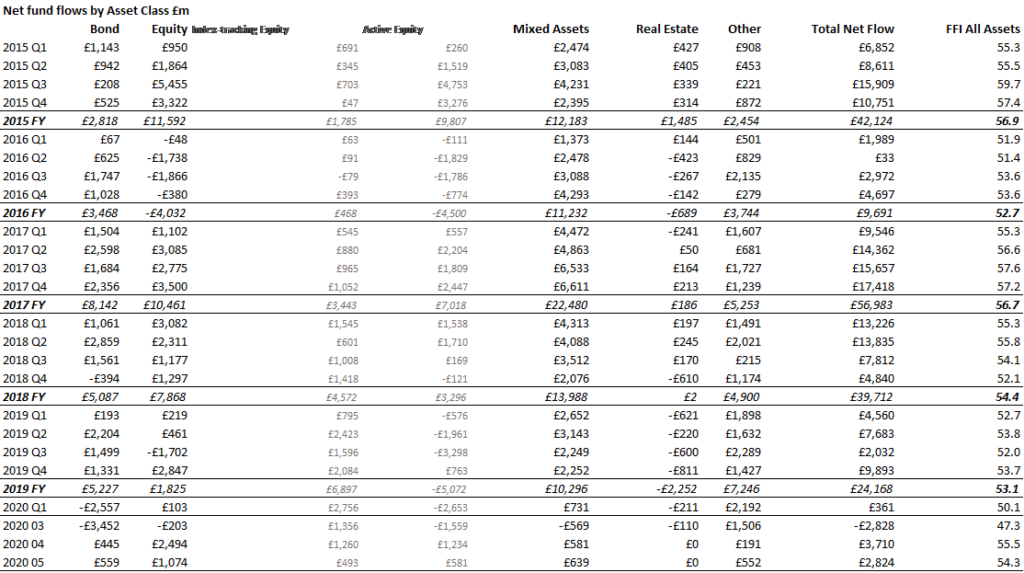
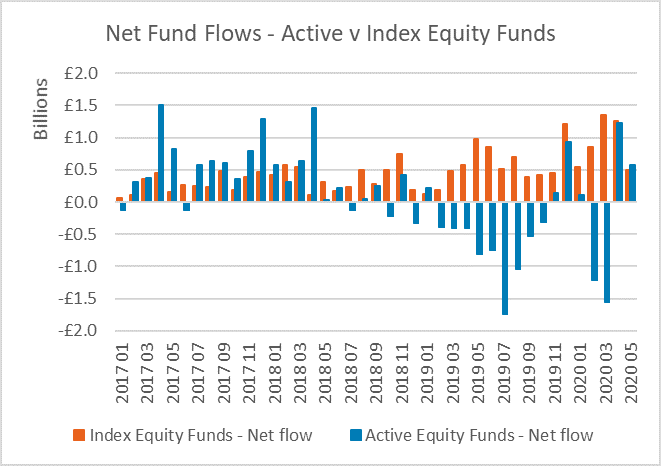
Equity funds enjoyed one of their best months for two years in May, absorbing £1.1bn of new capital, according to the latest Fund Flow Index (FFI) from Calastone, the largest global funds network. May 2020 was one of only four months since May 2018 to have seen net inflows exceed the £1bn mark. Moreover, investor enthusiasm for equity funds in recent weeks meant that the flow of net new capital into equity funds in April and May exceeded the previous 18 months’ worth of inflows combined.
The Calastone FFI: Equity dropped back to a 53.1 in May from the exceptionally high 57.1 that it registered in April (a reading of 50 means buys equal sells), as the euphoria that characterised the stock market rally began to drain away. Indeed, the inflows almost all took place in the first week of May. By the time the first bank holiday weekend had ended, the mood was much more sober, and by the third week of the month, inflows had turned to outflows, before staging a modest recovery in the final few days.
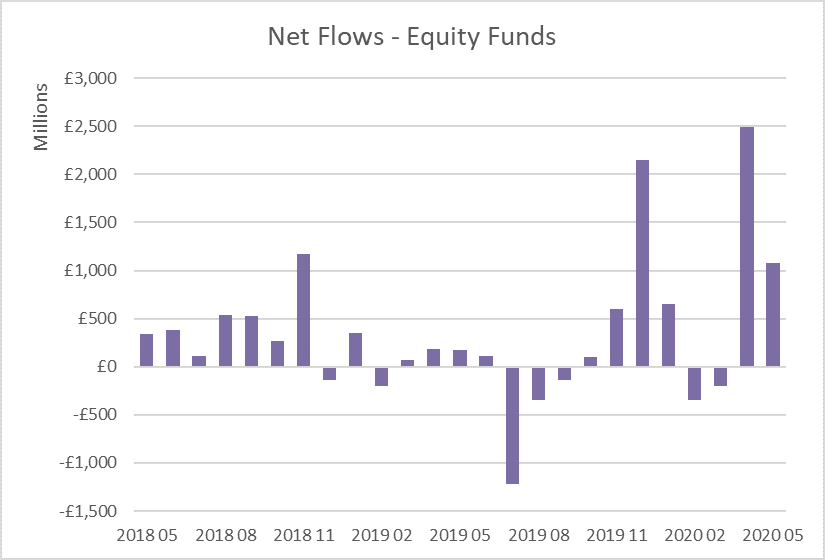
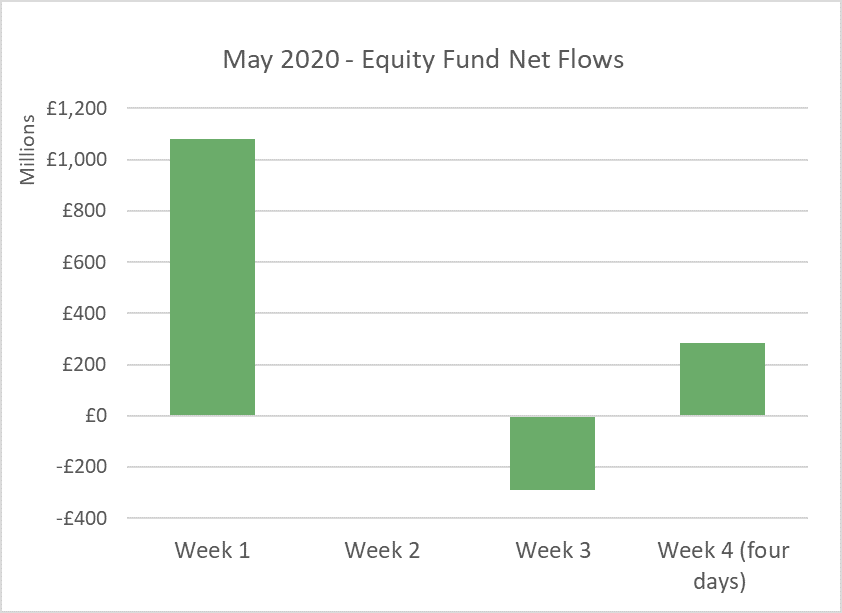 Overall trading volumes remained exceptionally high. Even though net inflows more than halved month-on-month, May saw the same value of buy and sell orders as in April. This shows that there was greater balance between buying and selling in May, with buying exceeding selling by a much smaller margin than the previous month.
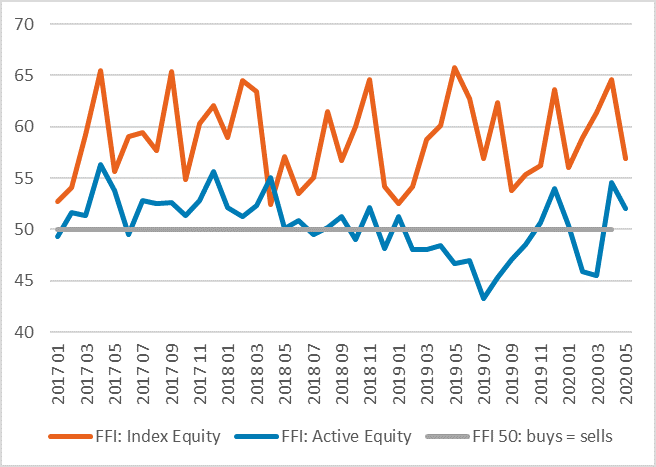
Active equity funds saw larger inflows (£581m) than passive funds (£493m) for only the third month in two years in May, though they also bore the brunt of the reversal of sentiment that took place during the middle of the month. Even so, at 56.9 our FFI:Index Equity remained well above the FFI:Active Equity reading of 52.1. The index value puts the net flow of funds into the context of total trading volumes - £100 of net inflows that resulted from lots of buying and selling would yield a much lower FFI reading than the same inflow where most of the orders were buys. Active funds registered a lower FFI because there is typically more two-way trading in active funds, whereas passive funds see steadier buying over time. In fact there have only been two months in more than four years when active funds have registered stronger index values. Moreover, active equity funds under management are around three times larger than index funds.
 The optimism was overwhelmingly directed at North American equity funds and global funds. By contrast, funds focused on UK equities saw inflows fall to their lowest level in more than six months, while European equity funds saw outflows surge to £376m, prompted by shock announcements of steep dividend cuts.
As caution increasingly characterised the mood during the month of May, so the appetite for the safety of money market funds rose. Money market funds saw outflows through April and into the first half of May as investor appetite for riskier assets like equities rose, but the more nervous mood prompted capital to return by the middle of the month. The market crash in March saw the largest inflow to money market funds on Calastone’s record, but in May the inflows were unusually large too as the value of buy orders outweighed sell orders almost 2:1.
A flood of Central Bank liquidity aimed at restoring order in the bond market helped cash to return to fixed income funds too after the extraordinary capital flight seen in March. Inflows rose to £559m, a little above the monthly average over the last few years.
Edward Glyn, head of global markets at Calastone commented: “Those who bought funds in early in April in record volumes took the opportunity to pick equities up on the cheap and have done well so far. The decision is more difficult following the rally. Investors are stuck between a rock and a hard place: interest rates are at or below zero across the developed world are pushing savings out of cash, but stock market valuations look high in the face of the historic economic crisis prompted by the pandemic. This is driving a lot of buying and selling as the news cycle unfolds and investors try to work out what it means for asset prices – the uncertainty helps explain why overall trading volumes across our network have been so high this year.
“‘Don’t bet against the Fed’ is a mantra that has served investors well over the last decade as QE around the world has forced asset prices higher and suppressed interest rates. That is clearly what fuelled the recent global market rally, though it is increasingly reliant on a narrower group of big companies especially US tech stocks. UK and European companies have announced wave after wave of dividend cuts that will slash total payouts in half this year[1], while US tech companies have so far been immune to the Covid 19 chill. It’s hardly surprising that investors chased funds where they perceived greater resilience, at least until part of the way through May.
“Since the middle of the month nerves have certainly begun to return, as weekly trading patterns are once again showing. Flows to equity funds showed signs of drying up while fearful investors once again sought out money market funds - among the safest assets that exist, even safer than bank deposits. The crisis has a long way to run.”
[1] Source: Link UK Dividend Monitor, Janus Henderson Global Dividend Index
