
Investors took a back seat in September, cutting back on the capital they added to fixed income, mixed asset funds compared to recent trends, according to the latest Fund Flow Index from Calastone, the largest global funds network. They increased their buying of equity funds to the highest level since May, but even so appetite was muted. Fund inflows across all asset classes were just £1.1bn, half the long run average, and despite UK savers having stashed a record additional £77bn of cash into savings accounts earning near-zero interest rates in the first half of 2020[1].
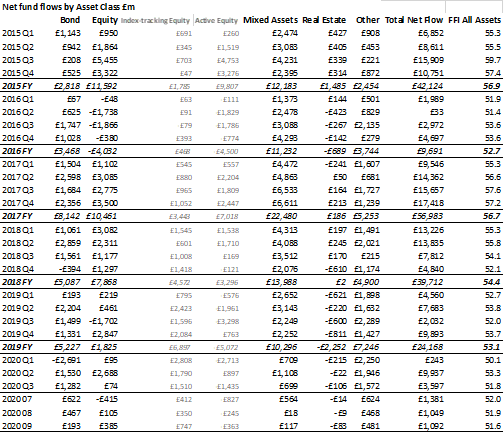
On the detail, inflows to fixed income funds fell sharply in September, dropping to £193m, following several months of strong demand as market rates compressed to record lows as the Covid-19 recession crushed economic activity. Inflows to mixed asset funds, the stalwarts of regular savings plans, were just £117m in September, well below the £397m monthly average for the last year.
In this context, the £385m inflow to equity funds looked strong, and indeed it was the highest since May in what has been a very volatile year of inflows and outflows for the sector. Nevertheless, in the longer-term context this inflow was below average. It did, however, mask significant differences between equity categories.
The big winners were ESG equity funds, which saw £588m of inflows (active plus passive ESG), while traditional equity funds without an ESG mandate suffered outflows of £203m.
Equity index funds also benefited, enjoying £747m of inflows while active funds suffered a fourth consecutive month of outflows, totalling £362m in September.
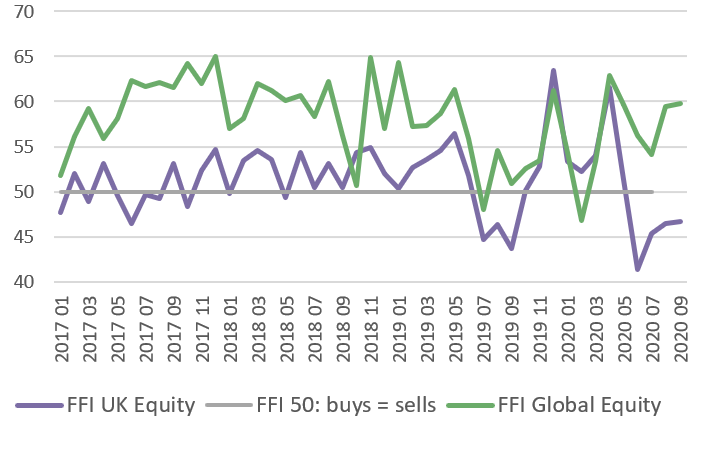
From a geographical perspective global funds remained the firm favourite (inflows of £831m) and European funds managed a second consecutive positive month, following years of outflows. But investors continued to shun UK-focused equity funds which have also now suffered four months of outflows in succession, and income funds (which tend to have a strong UK-equity bias). The chart below shows how UK equity funds have consistently been less popular than global funds over the least three years.
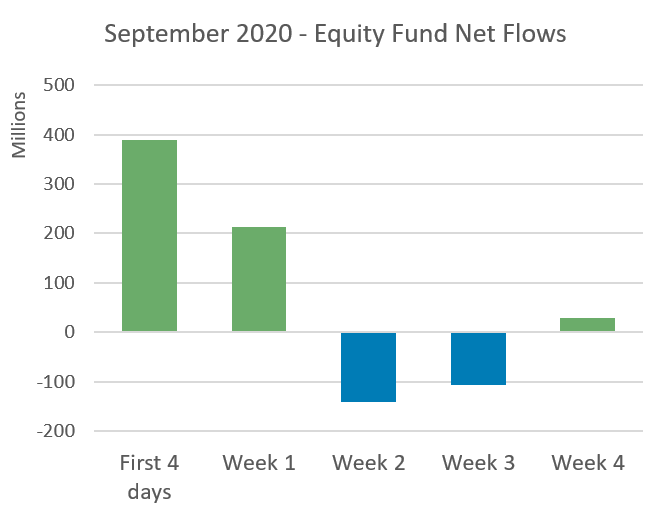
All the buying of equity funds took place in the first two weeks of the month as investors took advantage of a dip in stock markets following the market peak at the end of August.
 Edward Glyn, head of global markets at Calastone said: “Investors are nervous. The vast sums of cash accumulating in households’ savings accounts are not finding their way into asset markets as savers both add to their rainy-day funds and fret about taking on more investment risk at a time of such uncertainty. Even so there are clear bright spots and clear no-go areas. UK-focused equity funds seem condemned to the doldrums unless the Brexit talks yield a positive outcome and income funds are out of favour while the dividend pain is prolonged. But the strong demand for ESG funds shows that an interesting story can still drive investor demand, while the appetite for global funds suggests that investors recognise the value of diversifying their equity investments at a time when unexpected good and bad news can come seemingly from any direction at any time.”
 [1] Source: Henderson Investment Trusts, Bank of England