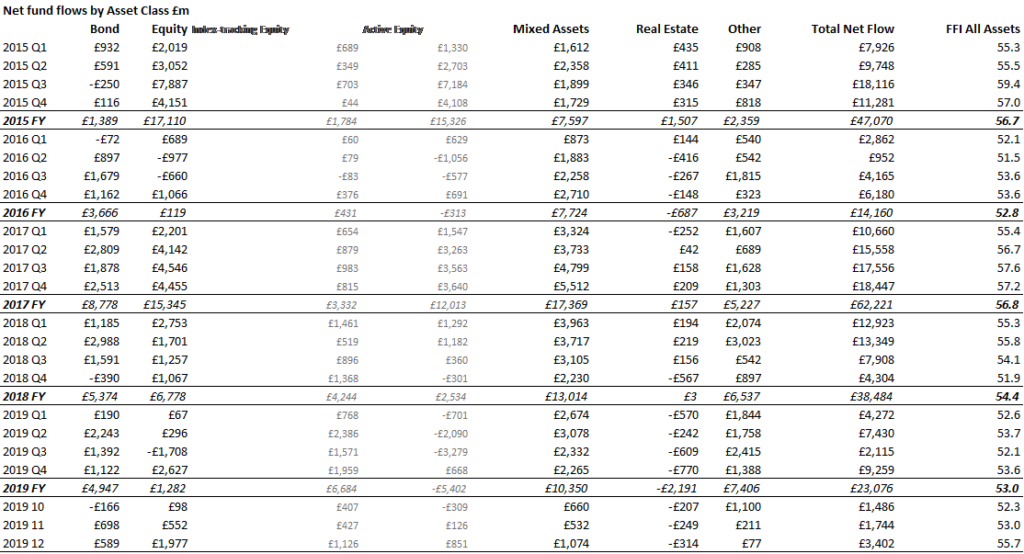
2019 saw very mixed fortunes for the UK funds industry, according to the Fund Flow Index (FFI) from Calastone, the largest global funds network. Of the four main asset classes, equity funds, which had been on track for their first annual outflow on record, pulled out a dramatic 11th hour reversal in December and ended the year with a small surplus. Fixed income funds maintained healthy inflows, but mixed asset funds were the big winners, enjoying another strong, steady year of new capital. Property funds suffered their worst year on record, as investor cash fled the sector.
Only the niche fund categories of absolute return and alternatives, both flavour of the month with investors between 2015 and 2017, saw worse outflows in relative terms than real estate, shedding a punishing one twelfth and one eighth of their respective assets under management. Meanwhile 2019 saw dramatic divergence between the fortunes of active and index funds.
 Equity funds are the largest category by assets under management (AUM). By the end of November, a series of weak months in the first half of the year, followed by a particularly damaging run of redemptions over the summer, heralded a likely first full year of outflows from equities on Calastone’s FFI record. However, a landslide general election victory for the Conservative Party in December drove unprecedented flows to UK-focused funds and hope of a trade deal between China and the US drove inflows to global, emerging market and North American funds. In total, December saw inflows of £2.0bn, the best month for two years.
Despite the strong finish, for the whole of 2019 equity funds saw inflows of £1.3bn, well below average, and just one fifth of the 2018 total. Moreover, excluding UK-focused funds there was a very small outflow for the full year. To put the full-year result in context, the £1.3bn inflow was equivalent to just 19 pence for every £100 in equity assets under management. The FFI: Equity was 50.4 for 2019, only just above the neutral 50 mark.
Equity funds are the largest category by assets under management (AUM). By the end of November, a series of weak months in the first half of the year, followed by a particularly damaging run of redemptions over the summer, heralded a likely first full year of outflows from equities on Calastone’s FFI record. However, a landslide general election victory for the Conservative Party in December drove unprecedented flows to UK-focused funds and hope of a trade deal between China and the US drove inflows to global, emerging market and North American funds. In total, December saw inflows of £2.0bn, the best month for two years.
Despite the strong finish, for the whole of 2019 equity funds saw inflows of £1.3bn, well below average, and just one fifth of the 2018 total. Moreover, excluding UK-focused funds there was a very small outflow for the full year. To put the full-year result in context, the £1.3bn inflow was equivalent to just 19 pence for every £100 in equity assets under management. The FFI: Equity was 50.4 for 2019, only just above the neutral 50 mark.
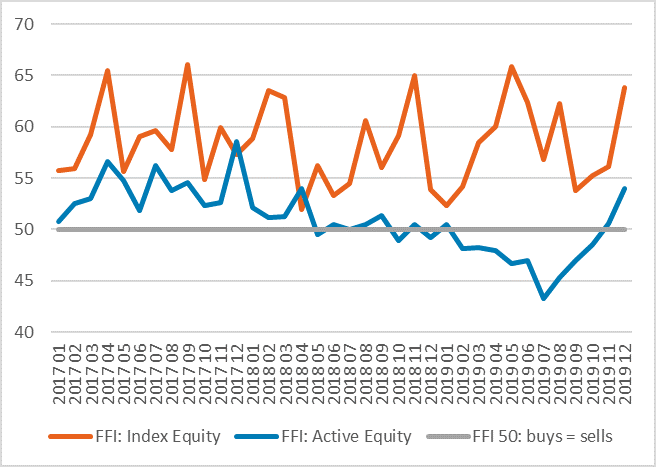
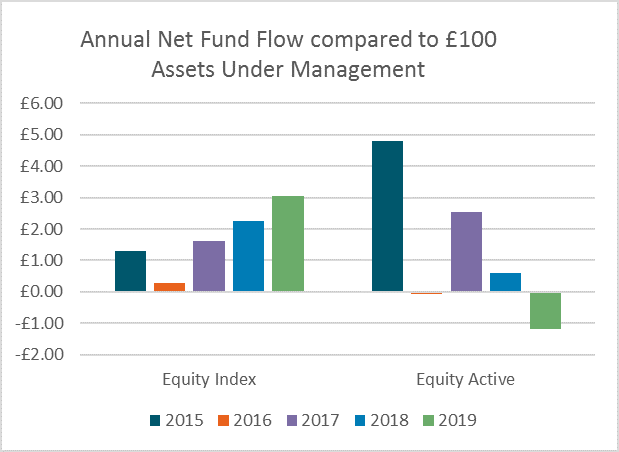 But there were very contrasting fortunes for index funds compared to active funds. While the former enjoyed their best-ever year of inflows, with £6.7bn of new capital, the latter endured their worst, as investors withdrew an unprecedented £5.4bn. Only active global funds saw larger inflows than passive ones; every other equity category saw index funds do better. Compared to AUM the contrast is even greater: index funds enjoyed £3 of inflows for every £100 invested, while active funds shed £1.20. Active European and active income funds were particularly hard hit.
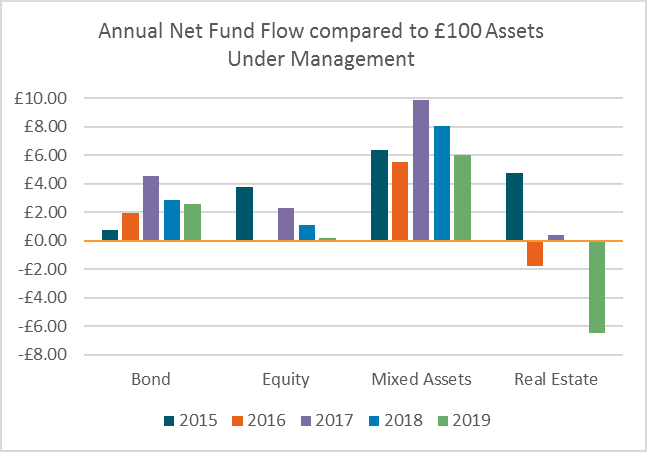
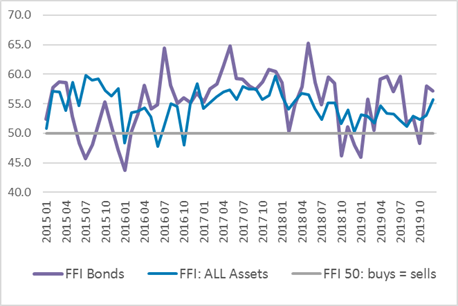
 Fixed income funds enjoyed their fourth strong year in a row with inflows of £4.9bn. This was equivalent to £2.60 for every £100 under management. Calastone’s FFI: Bonds was a healthy 54.6 for the full year.
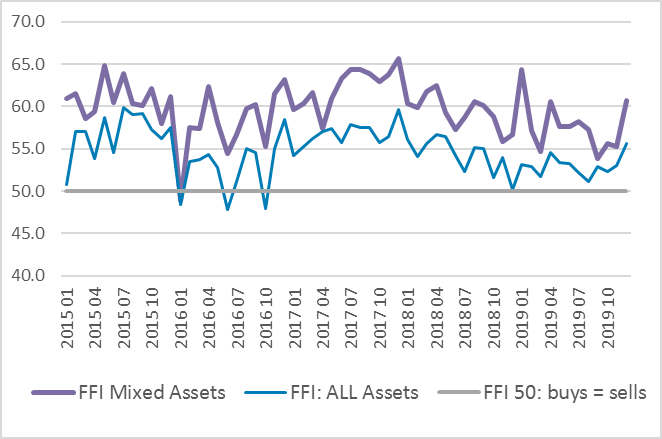
Mixed asset funds enjoyed the most consistent inflows through the year among the main asset classes. The total inflow of £10.4bn in 2019 was almost 8 times larger than equities, while the FFI: Mixed Assets of 57.7 for the full year was easily the strongest of the four main asset classes. Over the last five years inflows totalling an astonishing £56bn have pushed up mixed asset AUM by almost half, making them almost as large as bond funds. Last year alone, £6 flowed into the sector for every £100 under management, easily the largest flow:value ratio of any of the main asset classes.
Fixed income funds enjoyed their fourth strong year in a row with inflows of £4.9bn. This was equivalent to £2.60 for every £100 under management. Calastone’s FFI: Bonds was a healthy 54.6 for the full year.
Mixed asset funds enjoyed the most consistent inflows through the year among the main asset classes. The total inflow of £10.4bn in 2019 was almost 8 times larger than equities, while the FFI: Mixed Assets of 57.7 for the full year was easily the strongest of the four main asset classes. Over the last five years inflows totalling an astonishing £56bn have pushed up mixed asset AUM by almost half, making them almost as large as bond funds. Last year alone, £6 flowed into the sector for every £100 under management, easily the largest flow:value ratio of any of the main asset classes.
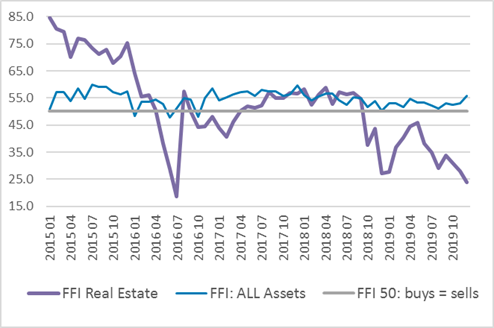
 Among the main four asset classes, property funds alone saw net outflows of capital. For the full year in 2019, investors withdrew a record net £2.2bn, with December 2019 marking a record 15th consecutive month of outflows. This has been the largest and most sustained outflow of capital on record and it led to the high-profile suspension of trading in one large fund in December. That event predictably spurred even faster outflows from the rest of the peer group.
 The FFI: Real Estate measured just 34.3 for the full year, its worst on record. Moreover, the outflows are very large compared to assets under management. During 2019 alone, more than £6.48 in every £100 invested was withdrawn, an unprecedented level for such a well-established sector. The outflow pressure is forcing fund managers to maintain very high levels of cash, diluting returns for investors.
Edward Glyn, head of global markets at Calastone commented: “As recently as October we thought it unlikely that equity funds would avoid their first annual net outflows on record for our index, with investors simply refusing to respond to rapid increases in stock markets. But electoral and trade news prompted a truly dramatic turnaround in December, proving how important politics, whether geo- or domestic, are to investor decision-making.
Mixed asset funds remained the most popular category, but even they saw lower inflows during a year of fragile confidence, evidenced by the popularity of bond funds. Mixed asset funds are more firmly anchored in regular savings plans than other funds and they benefit from a less obvious association with any particular asset type or regional bias (eg UK, emerging markets etc) – both these factors make them less obvious targets for investor trading in response to market developments.
Alongside the ebb and flow of markets, the deeper currents in the asset management industry played out in 2019 too. Property funds are suffering from the tension between their illiquid asset bases and their open-ended structure, while the rise of index funds means that two thirds of equity flows in the last four years have been into passive funds, despite them only representing one third of equity assets under management, and in 2019 there was outright switching from active to passive. Elsewhere, absolute return and alternatives are examples of how the industry can be prone to faddy gold rushes – they are now firmly out of favour. They highlight that investors should be wary of chasing the latest new trend.”
The FFI: Real Estate measured just 34.3 for the full year, its worst on record. Moreover, the outflows are very large compared to assets under management. During 2019 alone, more than £6.48 in every £100 invested was withdrawn, an unprecedented level for such a well-established sector. The outflow pressure is forcing fund managers to maintain very high levels of cash, diluting returns for investors.
Edward Glyn, head of global markets at Calastone commented: “As recently as October we thought it unlikely that equity funds would avoid their first annual net outflows on record for our index, with investors simply refusing to respond to rapid increases in stock markets. But electoral and trade news prompted a truly dramatic turnaround in December, proving how important politics, whether geo- or domestic, are to investor decision-making.
Mixed asset funds remained the most popular category, but even they saw lower inflows during a year of fragile confidence, evidenced by the popularity of bond funds. Mixed asset funds are more firmly anchored in regular savings plans than other funds and they benefit from a less obvious association with any particular asset type or regional bias (eg UK, emerging markets etc) – both these factors make them less obvious targets for investor trading in response to market developments.
Alongside the ebb and flow of markets, the deeper currents in the asset management industry played out in 2019 too. Property funds are suffering from the tension between their illiquid asset bases and their open-ended structure, while the rise of index funds means that two thirds of equity flows in the last four years have been into passive funds, despite them only representing one third of equity assets under management, and in 2019 there was outright switching from active to passive. Elsewhere, absolute return and alternatives are examples of how the industry can be prone to faddy gold rushes – they are now firmly out of favour. They highlight that investors should be wary of chasing the latest new trend.”