British investors have opted for ESG funds over the last three years more enthusiastically than any other category of investment fund, according to a special edition of the Fund Flow Index from Calastone, the largest global funds network.
There are 373 funds in the UK that market themselves under one of the labels that fits the ESG category (see Appendix for more detail). Two-thirds of these are focused on equities but investors can also choose mixed asset and fixed income varieties.
Calastone analysed hundreds of millions of fund transactions to gauge investor appetite for different investment flavours. From 2015 to 2017, little or no new money was invested in ESG funds. The big change in appetite began in the autumn of 2017 and it seems to correlate most strongly to environmental concerns, rather than moral or social ones.
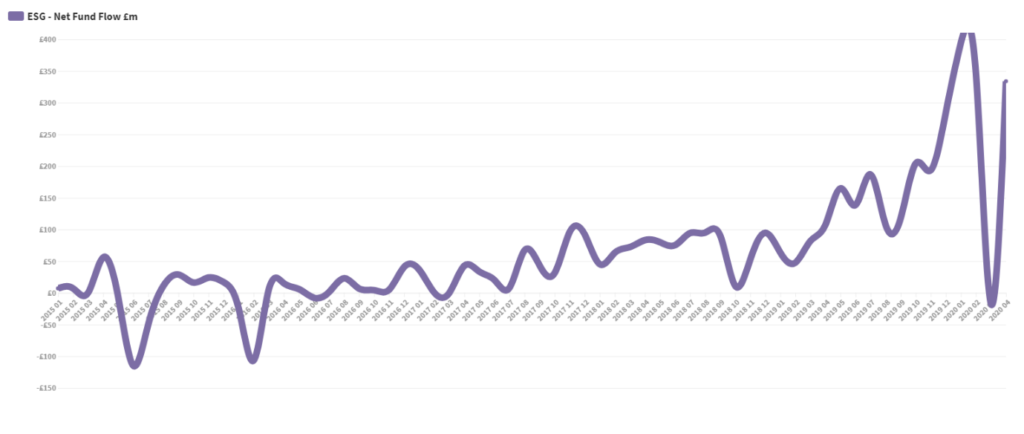
In the 31 months up to July 2017, a tiny net £107m was invested in ESG funds, the result of £6.4bn of two-way trading. There were several months of outflows too. In other words, buying activity roughly matched selling activity for almost three years.
In the 33 months after July 2017 (up to April 20), the total volume of trading more than doubled to £16.5bn, but far more of that trading was from buying activity as more and more investors opted for ESG funds. Net fund inflows jumped to £3.9bn, 37x greater than the net inflows running up to July 2017.
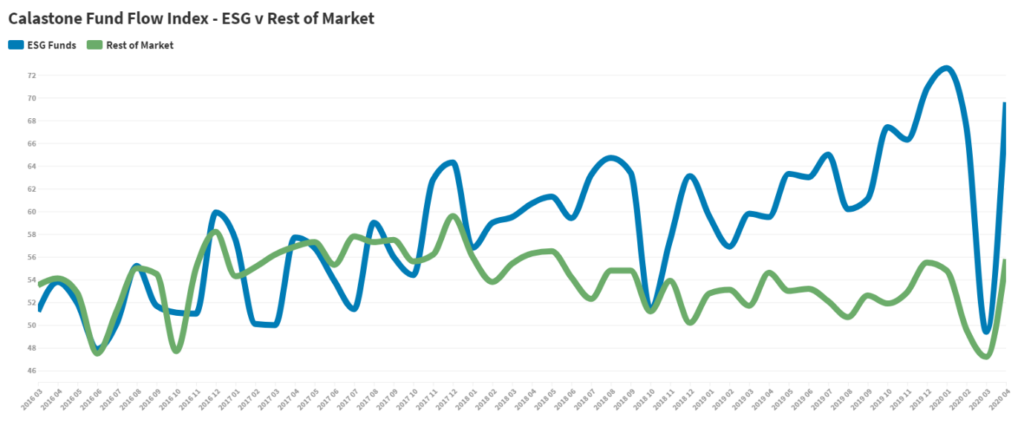
 In the last three years, Calastone’s ESG Fund Flow Index averaged 61.9, meaning that buying activity was almost two thirds larger than selling activity. This is comfortably the most positive reading for any of the fund categories Calastone measures. Passive equity funds, for example, have also been extremely popular, but these have only averaged a reading of 59.0, while global equity funds have registered 58.0. By contrast, in the same period active equity funds (excluding ESG) have seen a small outflow of capital, while European equity funds have been strongly negative, with FFI readings below the 50 neutral mark.
 January 2020 saw record inflows to ESG funds. £395m was invested – meaning that January saw almost as much new money as all of 2015, 2016 and 2017 put together. Even March 2020, which saw unprecedented outflows from funds as the pandemic shattered sentiment and saw billions flood out of ‘regular’ funds, ESG funds only saw £17m of outflows. Inflows returned in April to the tune of £334m.
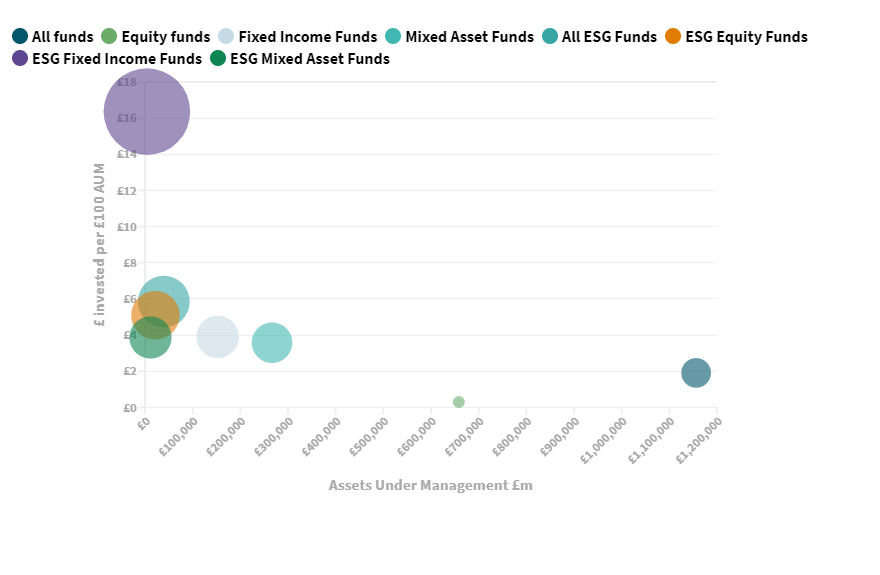
ESG funds are still a niche category compared to regular funds (only around 3% of the total market), so a good way of comparing the inflows is to consider them relative to the value of funds under management. In the year to the end of March ESG equity funds garnered £5.10 per £100 AUM, compared to just 30p for regular equity funds. The dots on the charts below plot the size of inflows relative to assets under management.
 Edward Glyn, Head of Global Markets at Calastone said: “ESG investment struggled for a long time to gain real, mainstream traction among investors, perhaps thanks to a lack of understanding and consistency around what labels like ‘ethical investment’ and ESG actually mean and therefore what the products offer. But it also reflected a perception that ESG investment may well entail lower returns.
This is now changing. Fund management groups are investing heavily in the category in response to growing investor demand. This higher profile for ESG funds and a growing focus on managing non-financial operating risk is driving demand higher too from institutional investors. There is also no reason why returns should be lower, especially as governments and courts around the world increasingly expect corporates to bear the cost of poor practices – the vast class-action suits against tobacco companies are a case in point.
It’s surely no coincidence that the growth in ethical funds took off in the autumn of 2017 when Blue Planet II shocked the world by revealing the extent of the ocean plastic pollution problem. A few months after that extinction rebellion was formed and then Greta Thunberg addressed the UN Climate Change Conference in Poland.”
Appendix:
History of ESG Investing
ESG investing applies moral and ethical principles in selecting investments. Shunning the slave trade and related investments was perhaps one of the earliest forms, right back in the 18th century. It has always been heavily influenced by religion. For example, the Church Commissioners have long expected their fund managers to exclude certain sectors, such as armaments, from their portfolios. More recently, Islamic investment has grown as a new category which excludes gambling, alcohol and other non-Islamic products and services.
Ethical and moral standards are inherently personal so creating a consistent ethical label is hard. But it also reflects the evolution of the category. The Church might have banned arms investments on moral grounds in the 1980s, but environmental or other social concerns may not have been relevant. If environmental concerns are my main concern, I might not care especially about tobacco, gambling or weapons. Or I may care more about corporate governance or social responsibility, for example around boardroom pay or companies promoting equal rights for workers.
The ESG label has proliferated. Funds now use all the following descriptors, to name just a few:
- Sustainable
- Responsible
- Climate Action
- Global Care
- Green
- Environmental
This means investors interested in the category have to engage closely to ensure their chosen fund delivers what they want. But it also suggests the market is responding by creating more ethical flavours to meet demand.
Analysis of Lipper Data showing number of ESG funds available to retail and institutional investors:
| Category |
UK |
Overseas |
| ALL |
373 |
5832 |
| Equity |
237 |
3049 |
| Fixed Income |
43 |
1128 |
| Mixed Assets |
87 |
1170 |
UK investors can pick from a growing range of funds, but AUM remains low.
At the end of Feb, AUM in ESG funds were £39bn, according to analysis of Lipper data, only a little over 3% of the total in the UK funds market
| Category |
UK |
AUM £bn |
% of all AUM |
| ALL |
373 |
£39.5 |
3.4% |
| Equity |
237 |
£21.9 |
3.3% |
| Fixed Income |
43 |
£4.0 |
2.6% |
| Mixed Assets |
87 |
£11.6 |
4.3% |
 In the last three years, Calastone’s ESG Fund Flow Index averaged 61.9, meaning that buying activity was almost two thirds larger than selling activity. This is comfortably the most positive reading for any of the fund categories Calastone measures. Passive equity funds, for example, have also been extremely popular, but these have only averaged a reading of 59.0, while global equity funds have registered 58.0. By contrast, in the same period active equity funds (excluding ESG) have seen a small outflow of capital, while European equity funds have been strongly negative, with FFI readings below the 50 neutral mark.
 January 2020 saw record inflows to ESG funds. £395m was invested – meaning that January saw almost as much new money as all of 2015, 2016 and 2017 put together. Even March 2020, which saw unprecedented outflows from funds as the pandemic shattered sentiment and saw billions flood out of ‘regular’ funds, ESG funds only saw £17m of outflows. Inflows returned in April to the tune of £334m.
ESG funds are still a niche category compared to regular funds (only around 3% of the total market), so a good way of comparing the inflows is to consider them relative to the value of funds under management. In the year to the end of March ESG equity funds garnered £5.10 per £100 AUM, compared to just 30p for regular equity funds. The dots on the charts below plot the size of inflows relative to assets under management.
 Edward Glyn, Head of Global Markets at Calastone said: “ESG investment struggled for a long time to gain real, mainstream traction among investors, perhaps thanks to a lack of understanding and consistency around what labels like ‘ethical investment’ and ESG actually mean and therefore what the products offer. But it also reflected a perception that ESG investment may well entail lower returns.
This is now changing. Fund management groups are investing heavily in the category in response to growing investor demand. This higher profile for ESG funds and a growing focus on managing non-financial operating risk is driving demand higher too from institutional investors. There is also no reason why returns should be lower, especially as governments and courts around the world increasingly expect corporates to bear the cost of poor practices – the vast class-action suits against tobacco companies are a case in point.
It’s surely no coincidence that the growth in ethical funds took off in the autumn of 2017 when Blue Planet II shocked the world by revealing the extent of the ocean plastic pollution problem. A few months after that extinction rebellion was formed and then Greta Thunberg addressed the UN Climate Change Conference in Poland.”
Appendix:
History of ESG Investing
ESG investing applies moral and ethical principles in selecting investments. Shunning the slave trade and related investments was perhaps one of the earliest forms, right back in the 18th century. It has always been heavily influenced by religion. For example, the Church Commissioners have long expected their fund managers to exclude certain sectors, such as armaments, from their portfolios. More recently, Islamic investment has grown as a new category which excludes gambling, alcohol and other non-Islamic products and services.
Ethical and moral standards are inherently personal so creating a consistent ethical label is hard. But it also reflects the evolution of the category. The Church might have banned arms investments on moral grounds in the 1980s, but environmental or other social concerns may not have been relevant. If environmental concerns are my main concern, I might not care especially about tobacco, gambling or weapons. Or I may care more about corporate governance or social responsibility, for example around boardroom pay or companies promoting equal rights for workers.
The ESG label has proliferated. Funds now use all the following descriptors, to name just a few:


