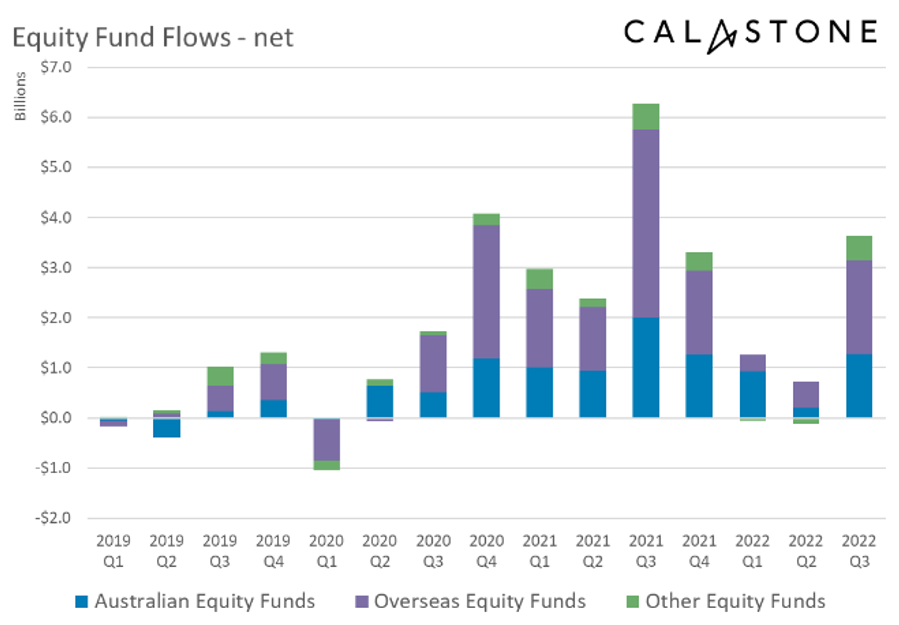
Australian investors greeted the new financial year in significantly more optimistic spirits than they ended the last one, though this optimism faded quickly. The latest quarterly Fund Flow Index from Calastone, the largest global funds network shows that between July and September, investors added A$3.63bn to managed equity funds, up from $605m in the previous quarter, when they had been spooked by the intensifying global bear market.

Australian equities benefited disproportionately from new cash for equity funds
A bear-market rally initially tempted investors back into the market. The ASX 200 recovered by over a tenth by the middle of August, trailing behind global equites. Domestically focused equity funds accounted for 37% of the net inflow between July and September, larger than their long run average share of 34%. at A$1.27bn, the net purchases of Australia-focused managed funds reached the second-largest quarterly total on Calastone’s four-year record. Global funds gained A$1.86bn, while only Asia-Pacific and European funds shed capital.
Active funds and ESG absorbed Q3’s new capital
Active funds were the big beneficiaries, accounting for three quarters of the total net inflow to equity funds overall. Equally, two fifths of the total net inflow to equities was directed to ESG funds (A$1.43bn), and almost all of this ESG capital was actively managed.
Investor enthusiasm waned as the quarter progressed – outflows by end of September
Investor enthusiasm waned as the quarter progressed. Net inflows to all equity funds of A$2.01bn in July slipped to A$1.28 in August. Then, as share prices rolled over towards the end of August, confidence slumped and net investment fell to A$342m in September, 60% below the monthly average for the last year. In the last five days of the quarter, there was a note of capitulation, however: investors sold a net A$122m.
The soft end to the quarter notwithstanding, Australians remained far more confident in the face of falling share prices than their UK counterparts, who were record sellers of equity funds over the three-month period.
Initial optimism on fixed income funds during bond market rally evaporated as yields soared and prices fell

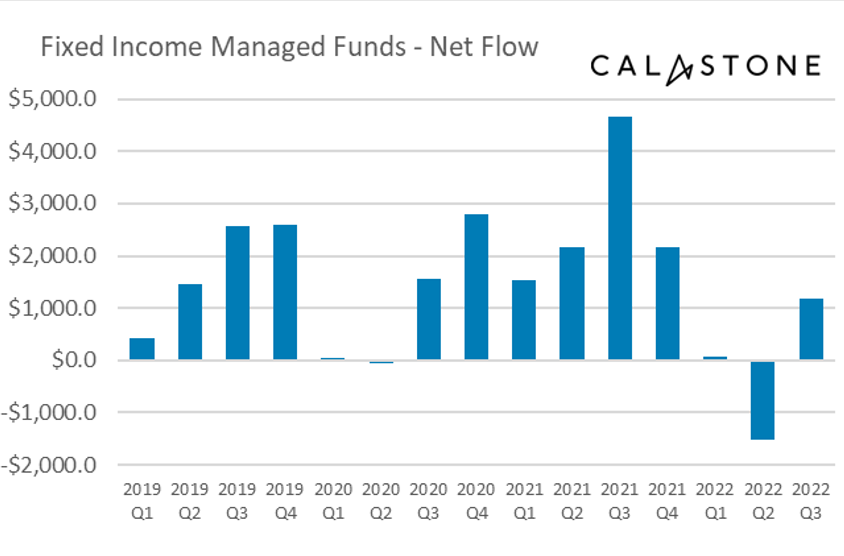
Patterns were similar in bond funds. Record selling of fixed income funds between April and June reflected a dramatic increase in bond yields (rising yields mean falling prices) in Australia and around the world. Then, bond markets rallied sharply from mid-June to the beginning of August – the Australian 10-year benchmark saw its yield drop by a staggering 120 basis points. The rally encouraged investors back into fixed income funds in July. Even as the rally faded in August, net buying continued, but as yields once again tested multi-year highs in September, purchases fell away. Over the three-month period, net inflows totalled A$1.19bn, but only A$41m of this was in September. Moreover, in the last six days of the quarter, investors were backing away – bond funds shed A$112m.
Mixed assets followed the same pattern, but real estate was more resilient
Among managed mixed asset funds, the same pattern repeated. Net inflows were large in the quarter as a whole – A$1.53bn – but they dropped away in September. Meanwhile, real estate funds reversed their April to June outflows with net new capital of A$259m in Q3. Even so, September’s A$64m real estate inflow was well below the long-run average.
Teresa Walker, Managing Director of Australia and New Zealand at Calastone said: “The surge in global bond yields is driving a dramatic repricing of assets of all kinds. Australian investors have been highly tuned to the bond markets in recent months, buying equities and bonds when yields have fallen (and bond and share prices have therefore risen) and running for cover when market conditions have turned. Seasonal patterns explain some of the initial burst of inflows in Q3, but enthusiasm to buy the bear-market rally was much greater in Australia than we have seen in some of Calastone’s other territories, especially the UK. Investors may feel they have been caught out.
“The distinct preference for domestic equities reflects the Australian market’s defensive characteristics. The economy is more resilient than in many other parts of the world, with lower inflation and solid public finances. Crucially, the heavy income focus coming from the dominant mining and banking sectors means share prices are less sensitive to higher bond yields than, say US tech stocks, and Australian dividends enjoy exceptionally favourable tax treatment. Sharply lower metals prices have now removed a level of support from sector payouts, though coal remains resilient. Banks may be vulnerable to any slowdown in the property market, but their dividends are well covered after cuts made during the pandemic rebased them to a more sustainable level.
“A less severe squeeze on the cost of living in Australia than elsewhere leaves more cash left for investment, but confidence is very fragile, evidenced by the reversal of fund flows at the very end of the quarter. The decisive end of the bear market is likely to come only when the interest-rate cycle turns.”

Methodology
Calastone analysed over half a million buy and sell orders every month from January 2019, tracking capital from advisers, platforms and as it flows into and out of managed funds. Data is collected until the close of business on the last day of each month. A single order is usually the aggregated value of a number of trades from underlying investors passed for example from a platform via Calastone to the fund manager. In reality therefore, the index is analysing the impact of many millions of investor decisions each month.
More than 95% of Australian managed fund flows pass across the Calastone network each month. All these trades are included in the FFI. To avoid double-counting, however, the team has excluded deals that represent transactions where funds of funds are buying those funds that comprise the portfolio.
The index is a measure of investor conviction, placing the net flow of capital into the context of overall trading volumes. It also allows the reader to compare flows in asset classes of different sizes – A$100m of inflows may be very large for a small, relatively new asset class like ESG equity but very small for a huge category like fixed income. A reading of 50 indicates that new money investors put into funds equals the value of redemptions (or sales) from funds. A reading of 100 would mean all activity was buying; a reading of 0 would mean all activity was selling. In other words, $1m of net inflows will score more highly if there is no selling activity, than it would if $1m was merely a small difference between a large amount of buying and a similarly large amount of selling.
Calastone’s FFI considers transactions only by Australia-based investors, placing orders for funds domiciled in Australia. The majority of this capital is advised, via platforms.


